Working at SigNoz
I joined SigNoz ⎯ an open-source observability platform in late 2023 to lead their design efforts. At that point, SigNoz had just raised a seed round led by SignalFire, with participation from Uncorrelated Ventures, Alumni Ventures, and angels including Tom Preston Werner (co-founder of GitHub) and Jiten Vaidya (ex-CEO of PlanetScale).
SigNoz had just released a managed cloud offering of their open-source observability platform that sought to bring the 3 key signals : Logs, Metrics, and Traces under the same umbrella.
In the time I have been there, the breadth of my responsibilities has increased to lead multiple product initiatives to revamp the signal explorers and also leading design for newer areas of the product.
Logs Explorer
The older Logs Explorer did not have a lot of features necessary to explore and work with Logs. I worked closely with the lead engineer for Logs to flesh out a new explorer that addressed a bunch of issues for developers using SigNoz.
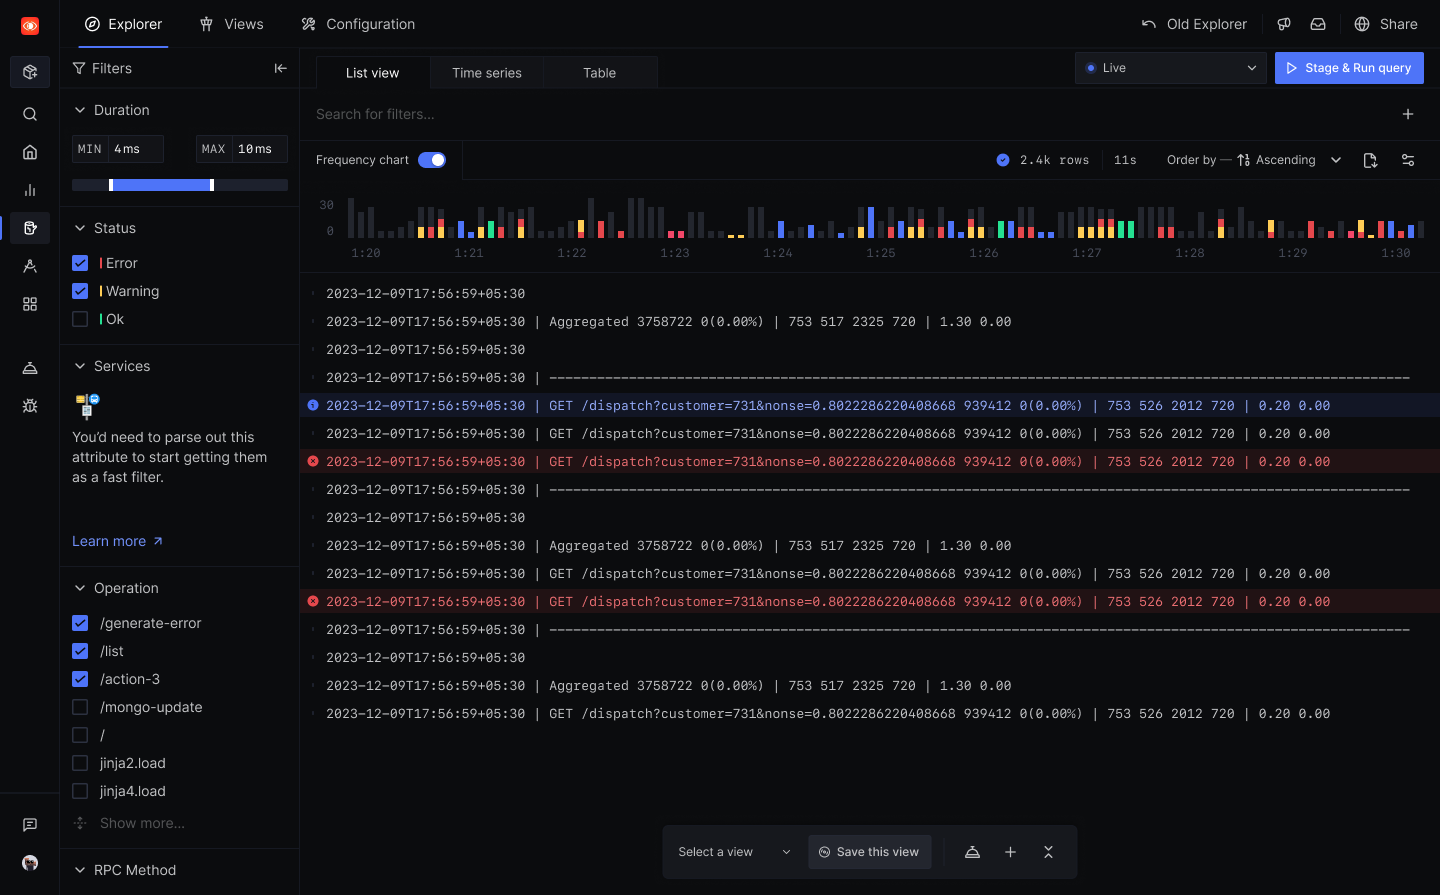
We added a bunch of features that were missing from the earlier versions, including (but not restricted to) -
- Ability to create dashboard panels right from the explorer.
- Ability to save a view for easier sharing and retaining context.
- Ability to create an alert rule.
- Fast filters on the secondary sidebar so that users can easily search and add filters they need without having to always rely on typing the filter parameters out.
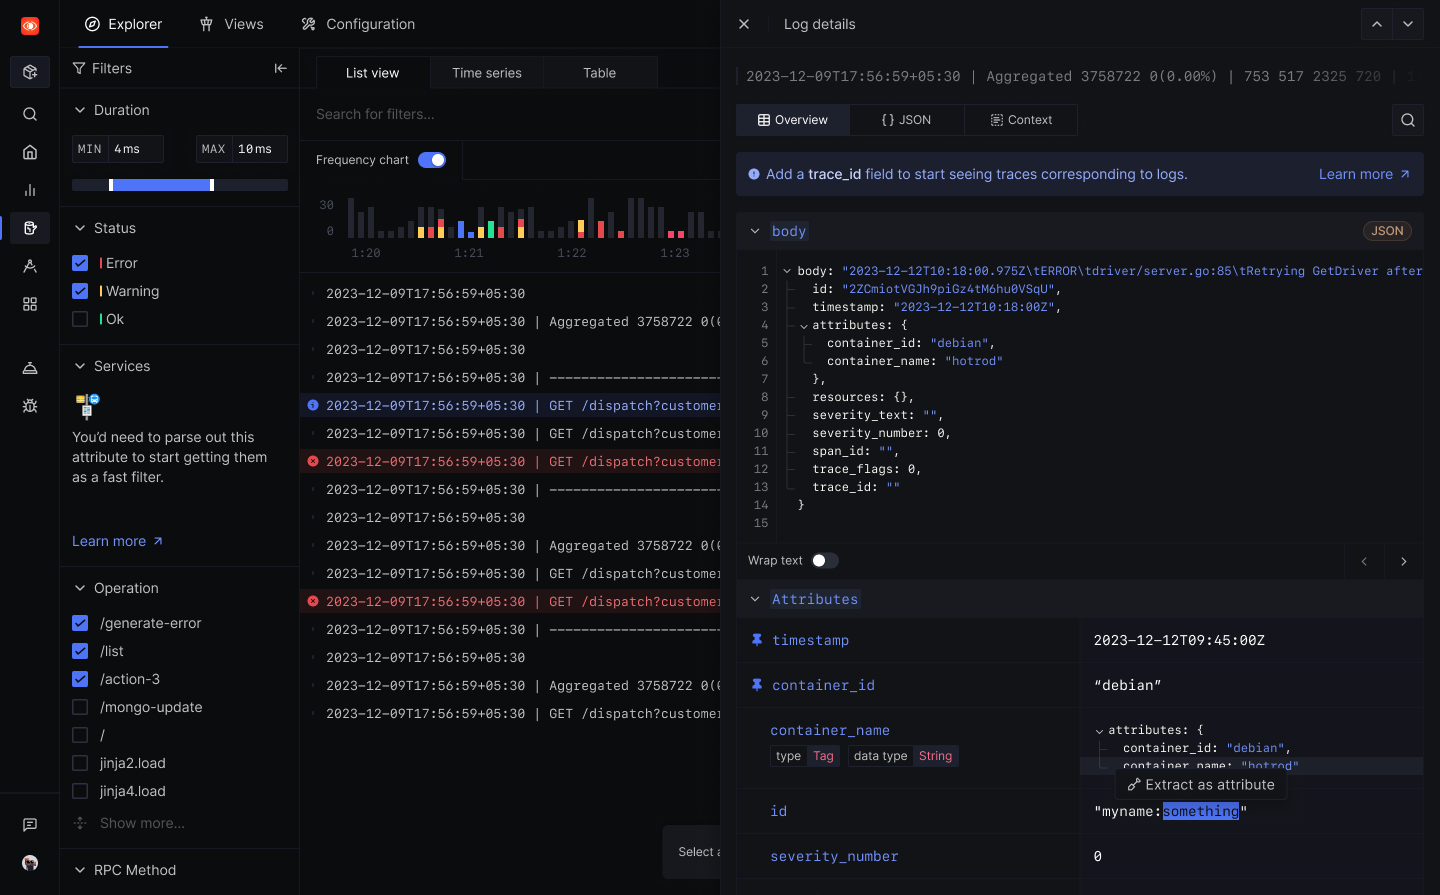
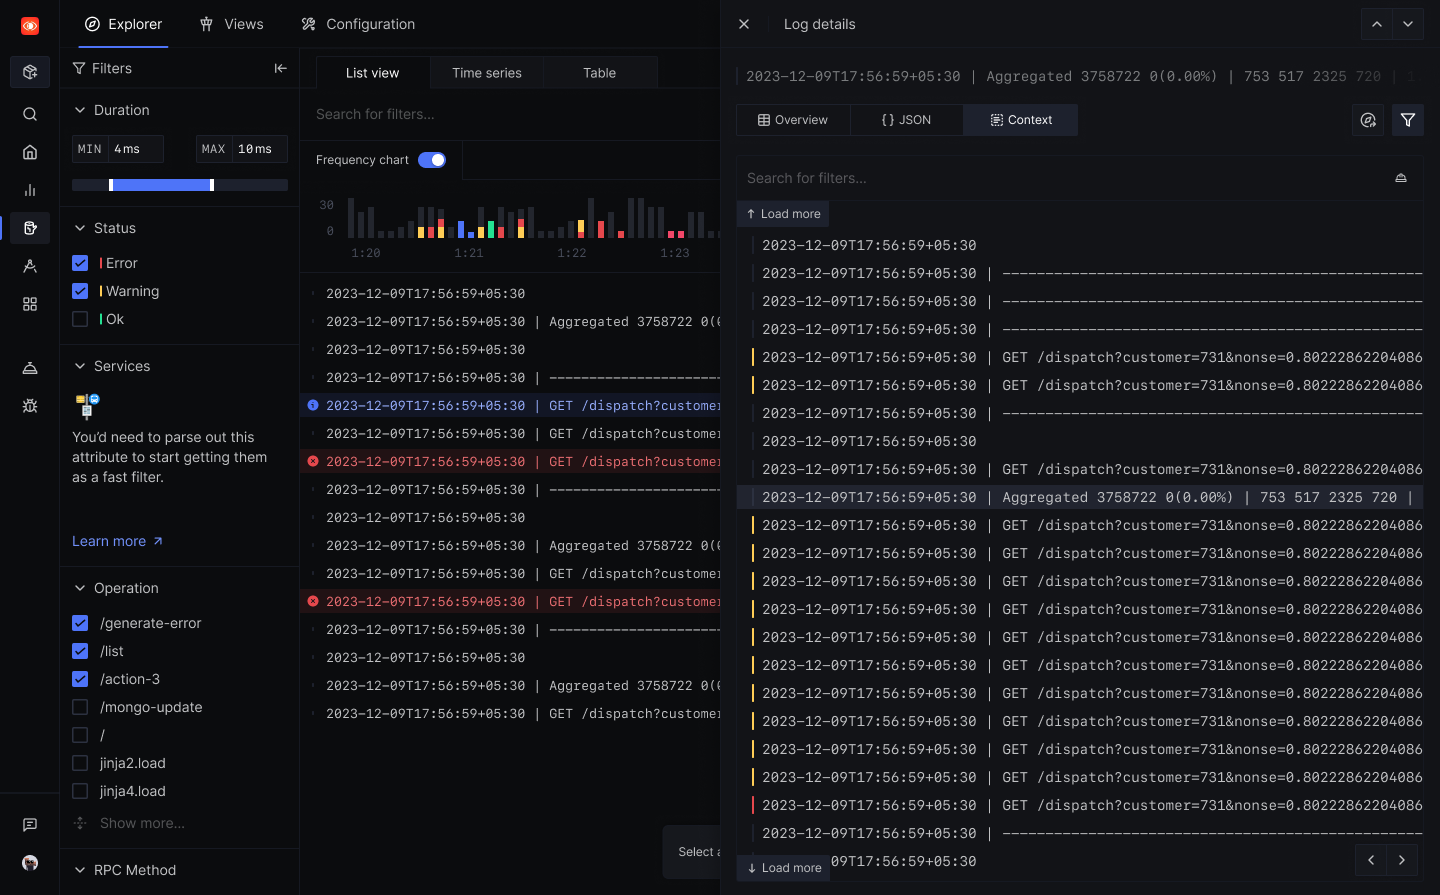
- We added the ability to see logs in context and do much powerful analysis by adding affordances to add attributes like
trace_iddirectly to logs and triggering pipelines to enable seamless correlation between multiple signals.
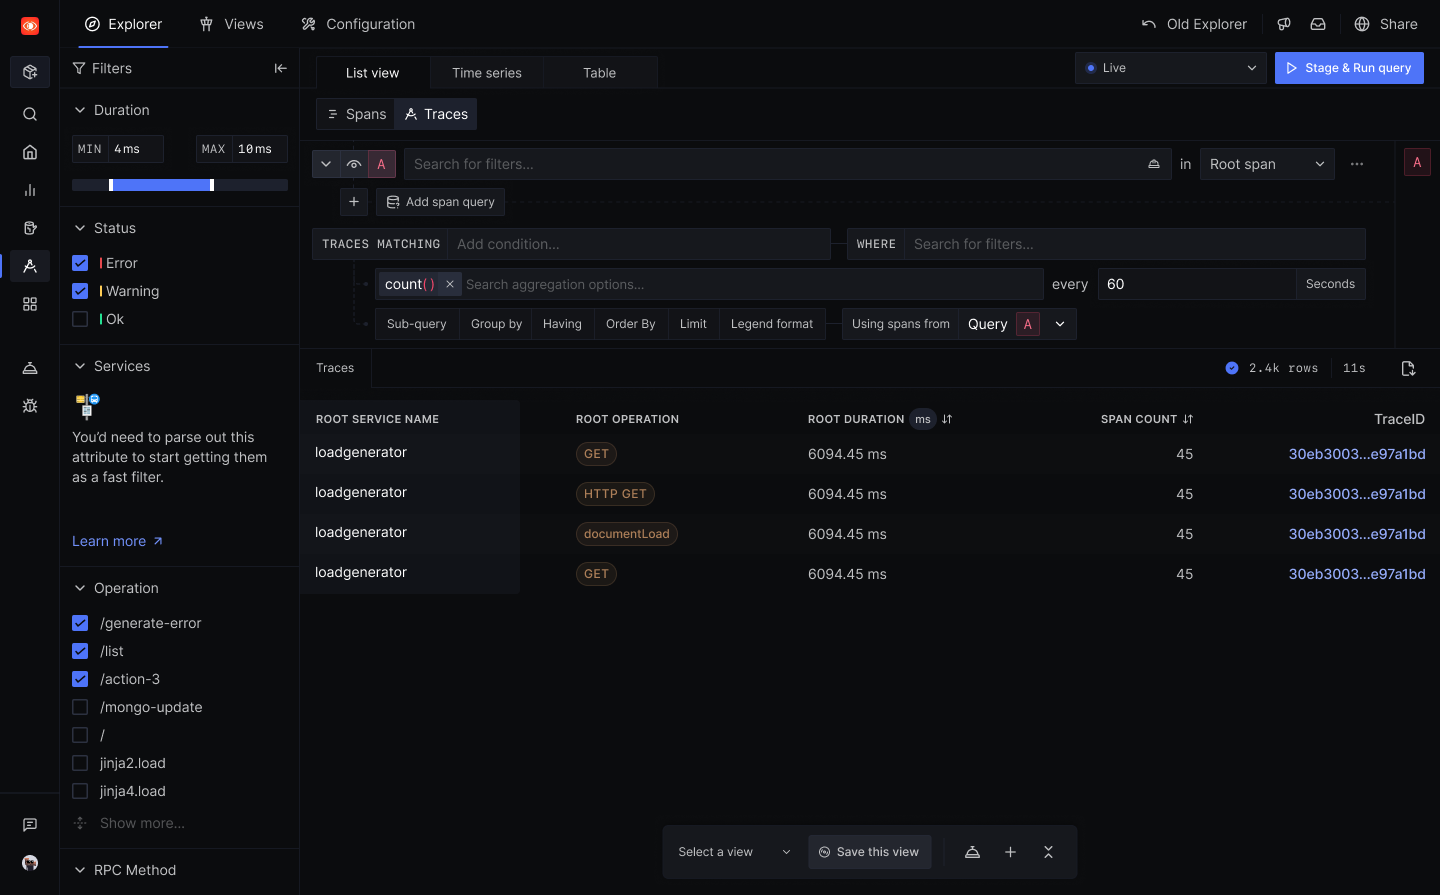
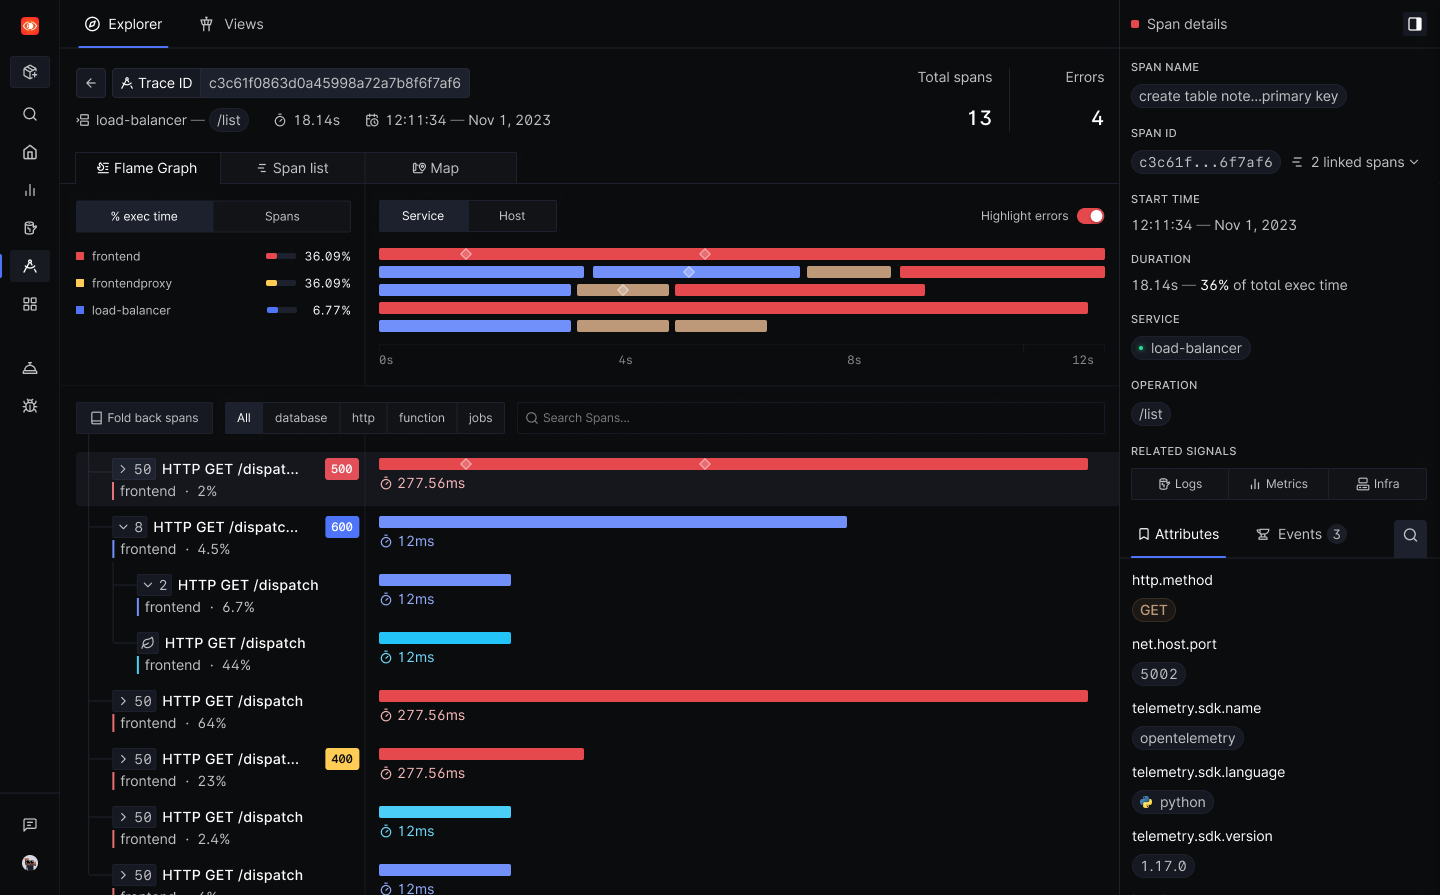
Trace Explorer
The trace explorer needed a sore revamp as well. We enhanced the query builder for traces and spans and engineered the ability to seamlessly load a million spans ⎯ the first distributed tracing tool with the ability to do that.
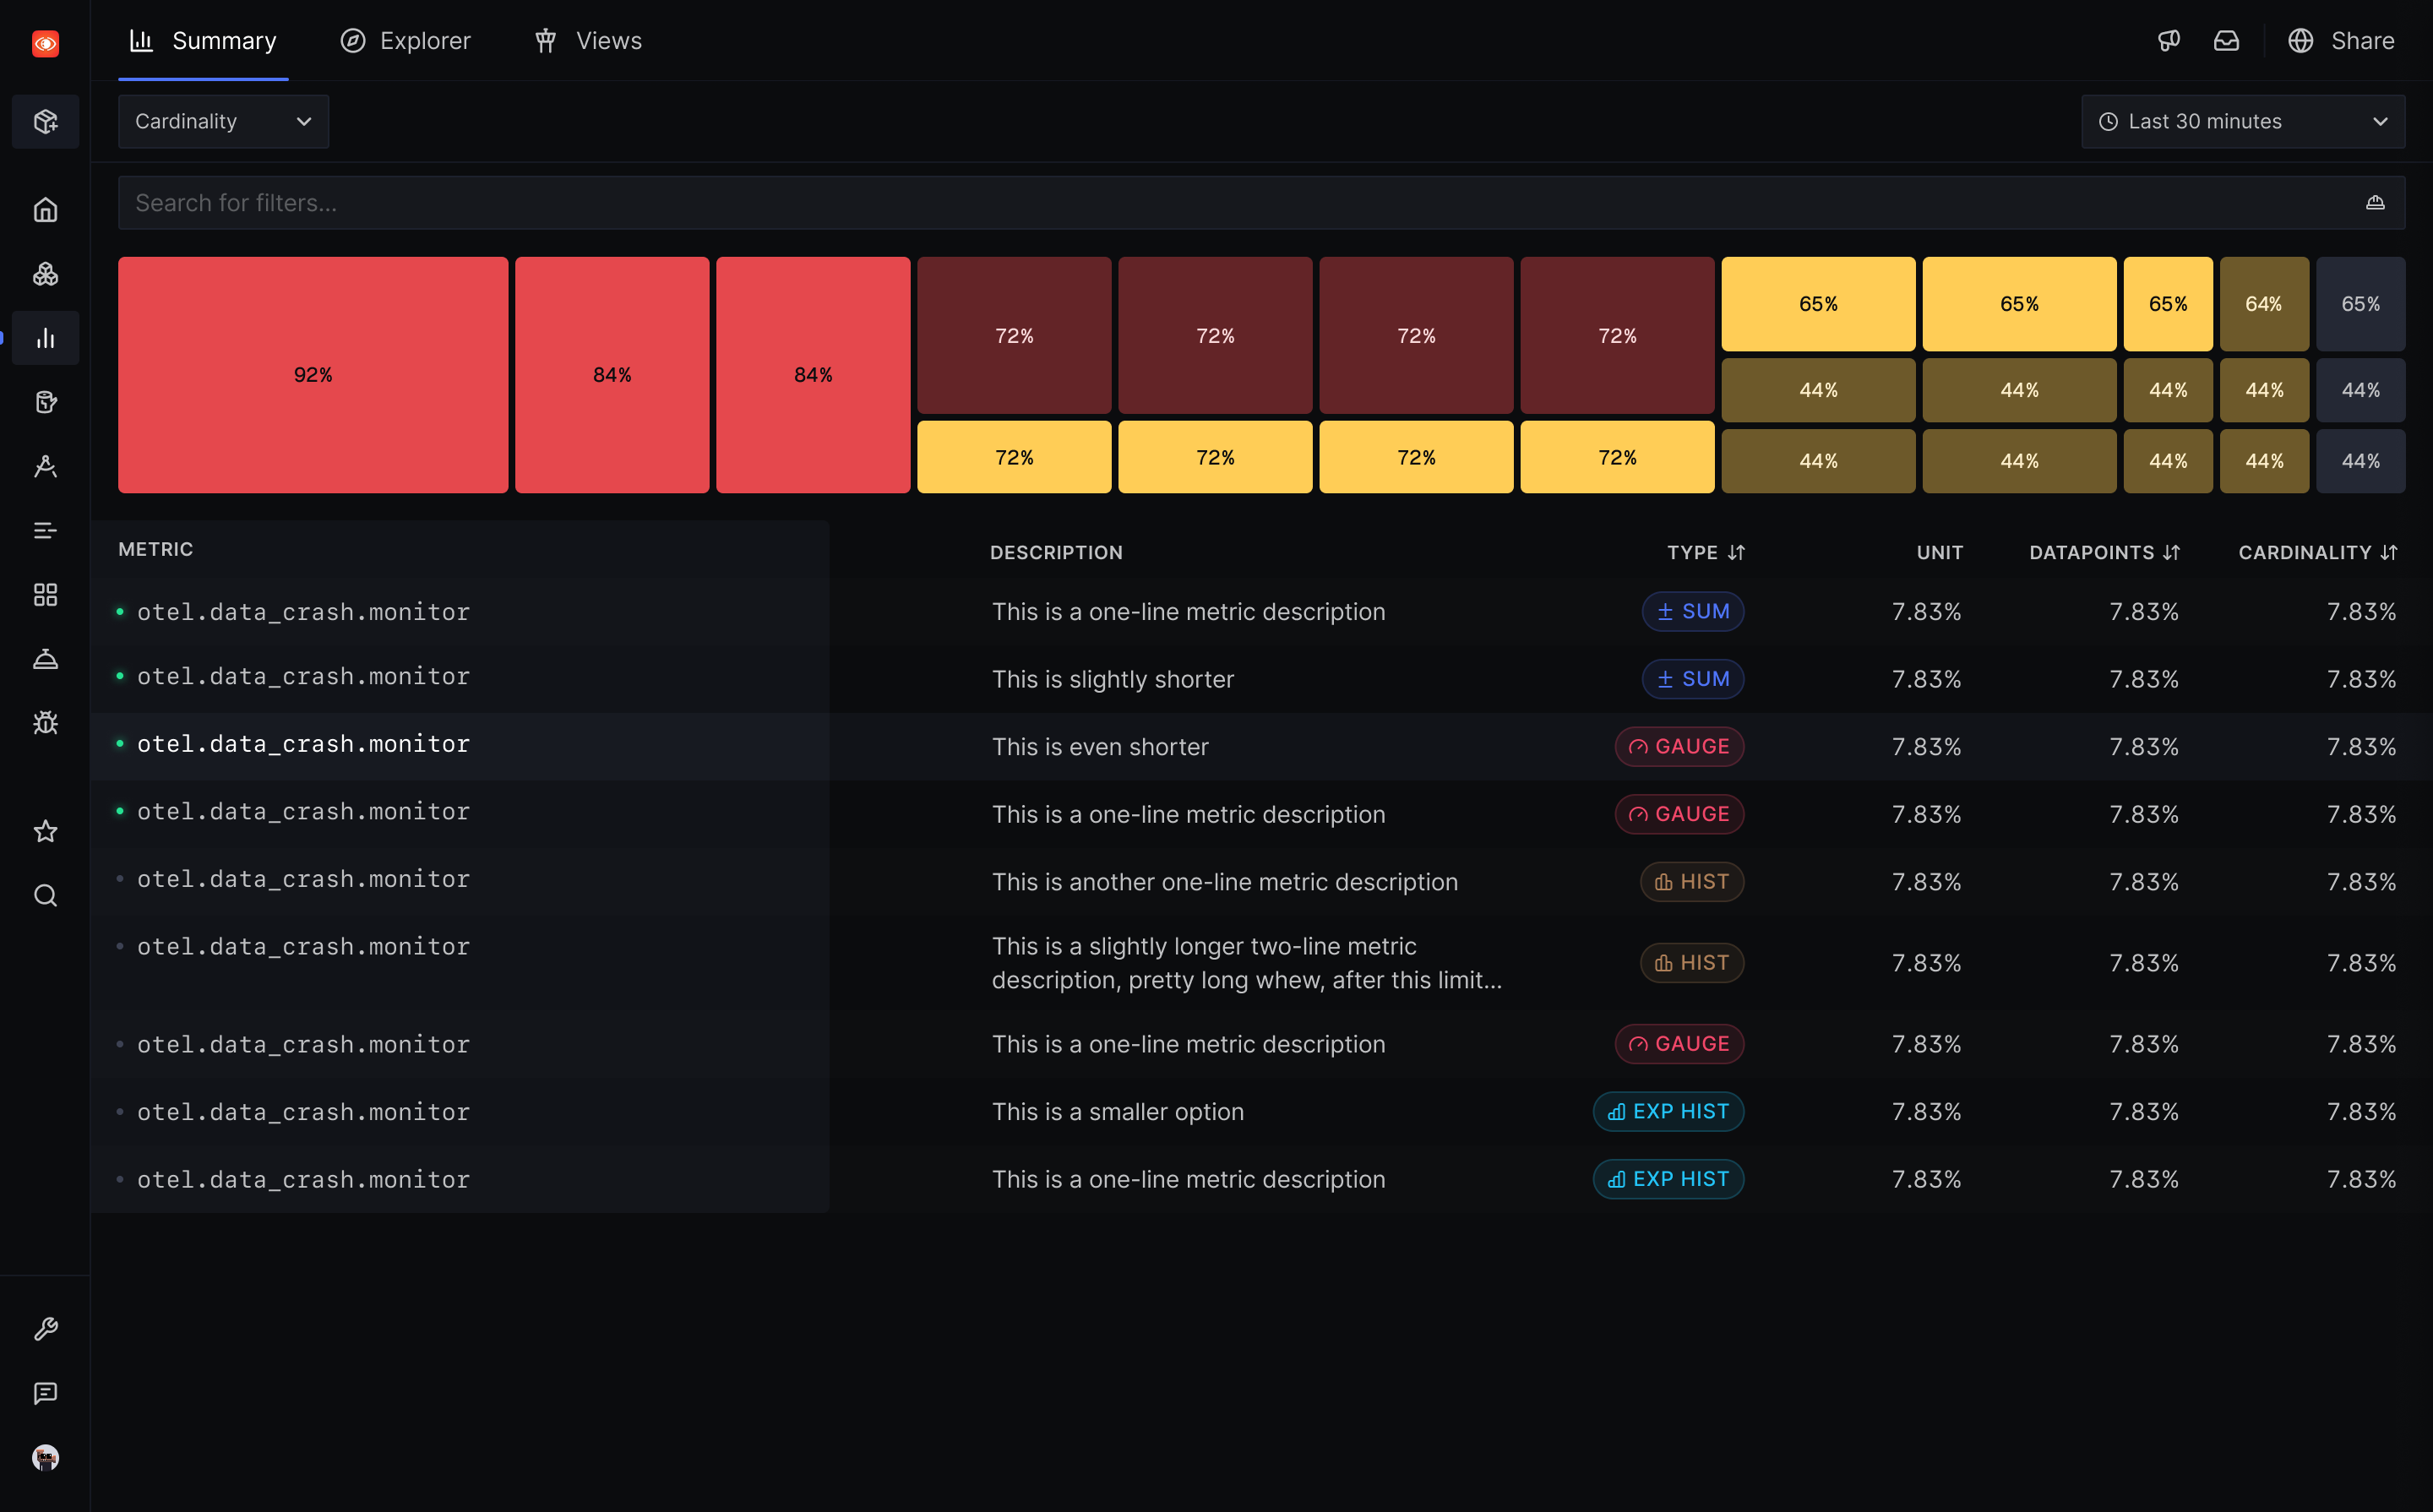
Metrics Explorer
We engineered a new Metrics Explorer from the ground up while parallely tracking another interesting problem -
Since SigNoz is open-source, a lot of early-career engineers also love using the tool, and while we did not have a dedicated Metrics Explorer to start with, while talking with our customers, we saw an underlying problem in understanding aggregation when it comes to metrics. Users who were more seasoned with PromQL were getting confused while working with our pretty primitive query builder as to how do we handle temporal and spatial aggregation.
To solve for that, we introduced a new feature called Inspect Mode that gave you a while playground to work with a metric and use different aggregations to see what brings you closest to the idea you had in mind.
Inspect Mode is currently in active development and I will be able to share more on that soon when we make the feature generally available.
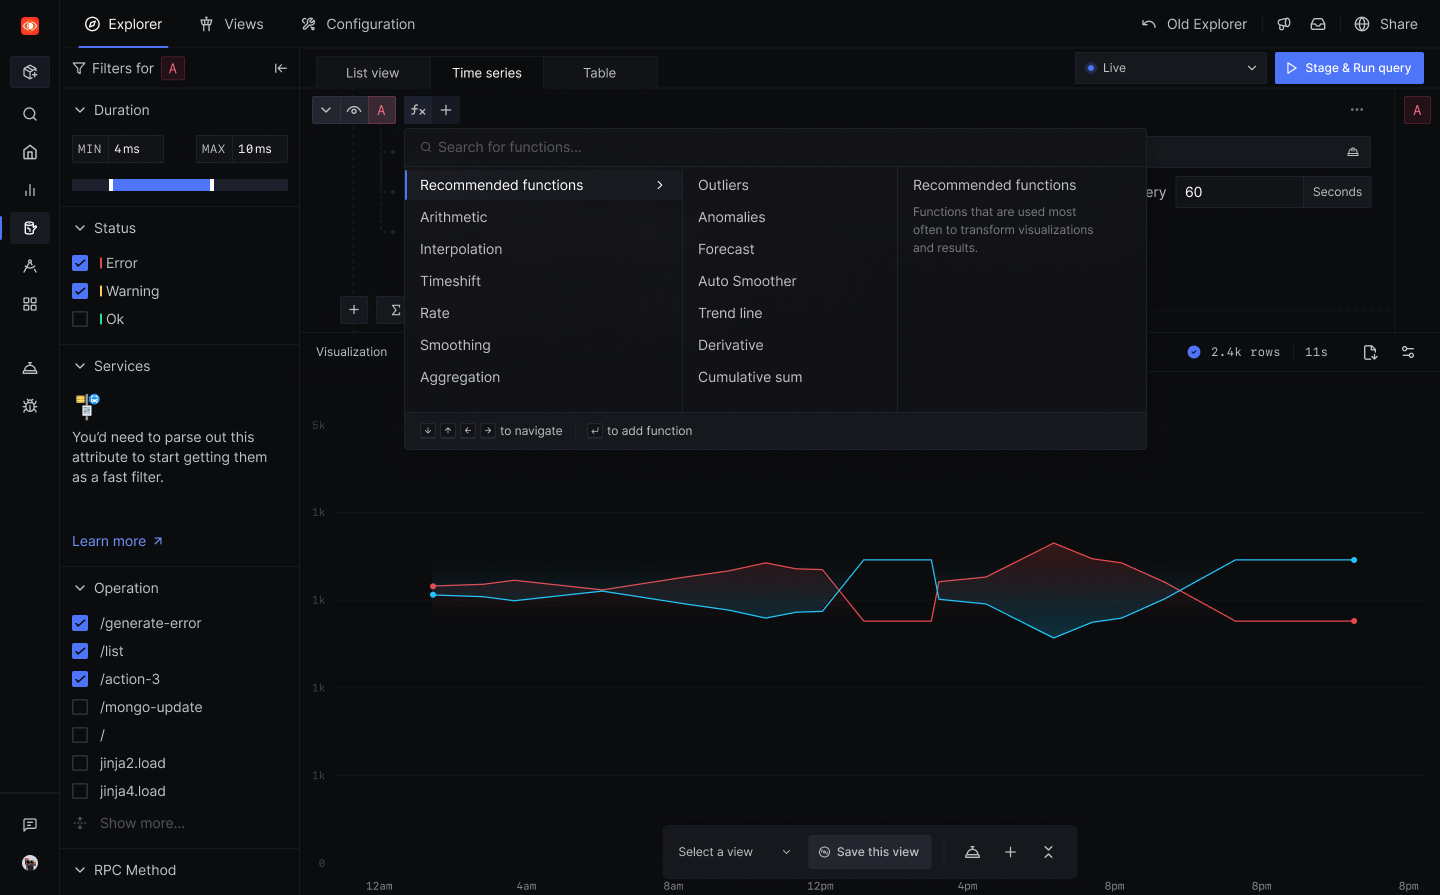
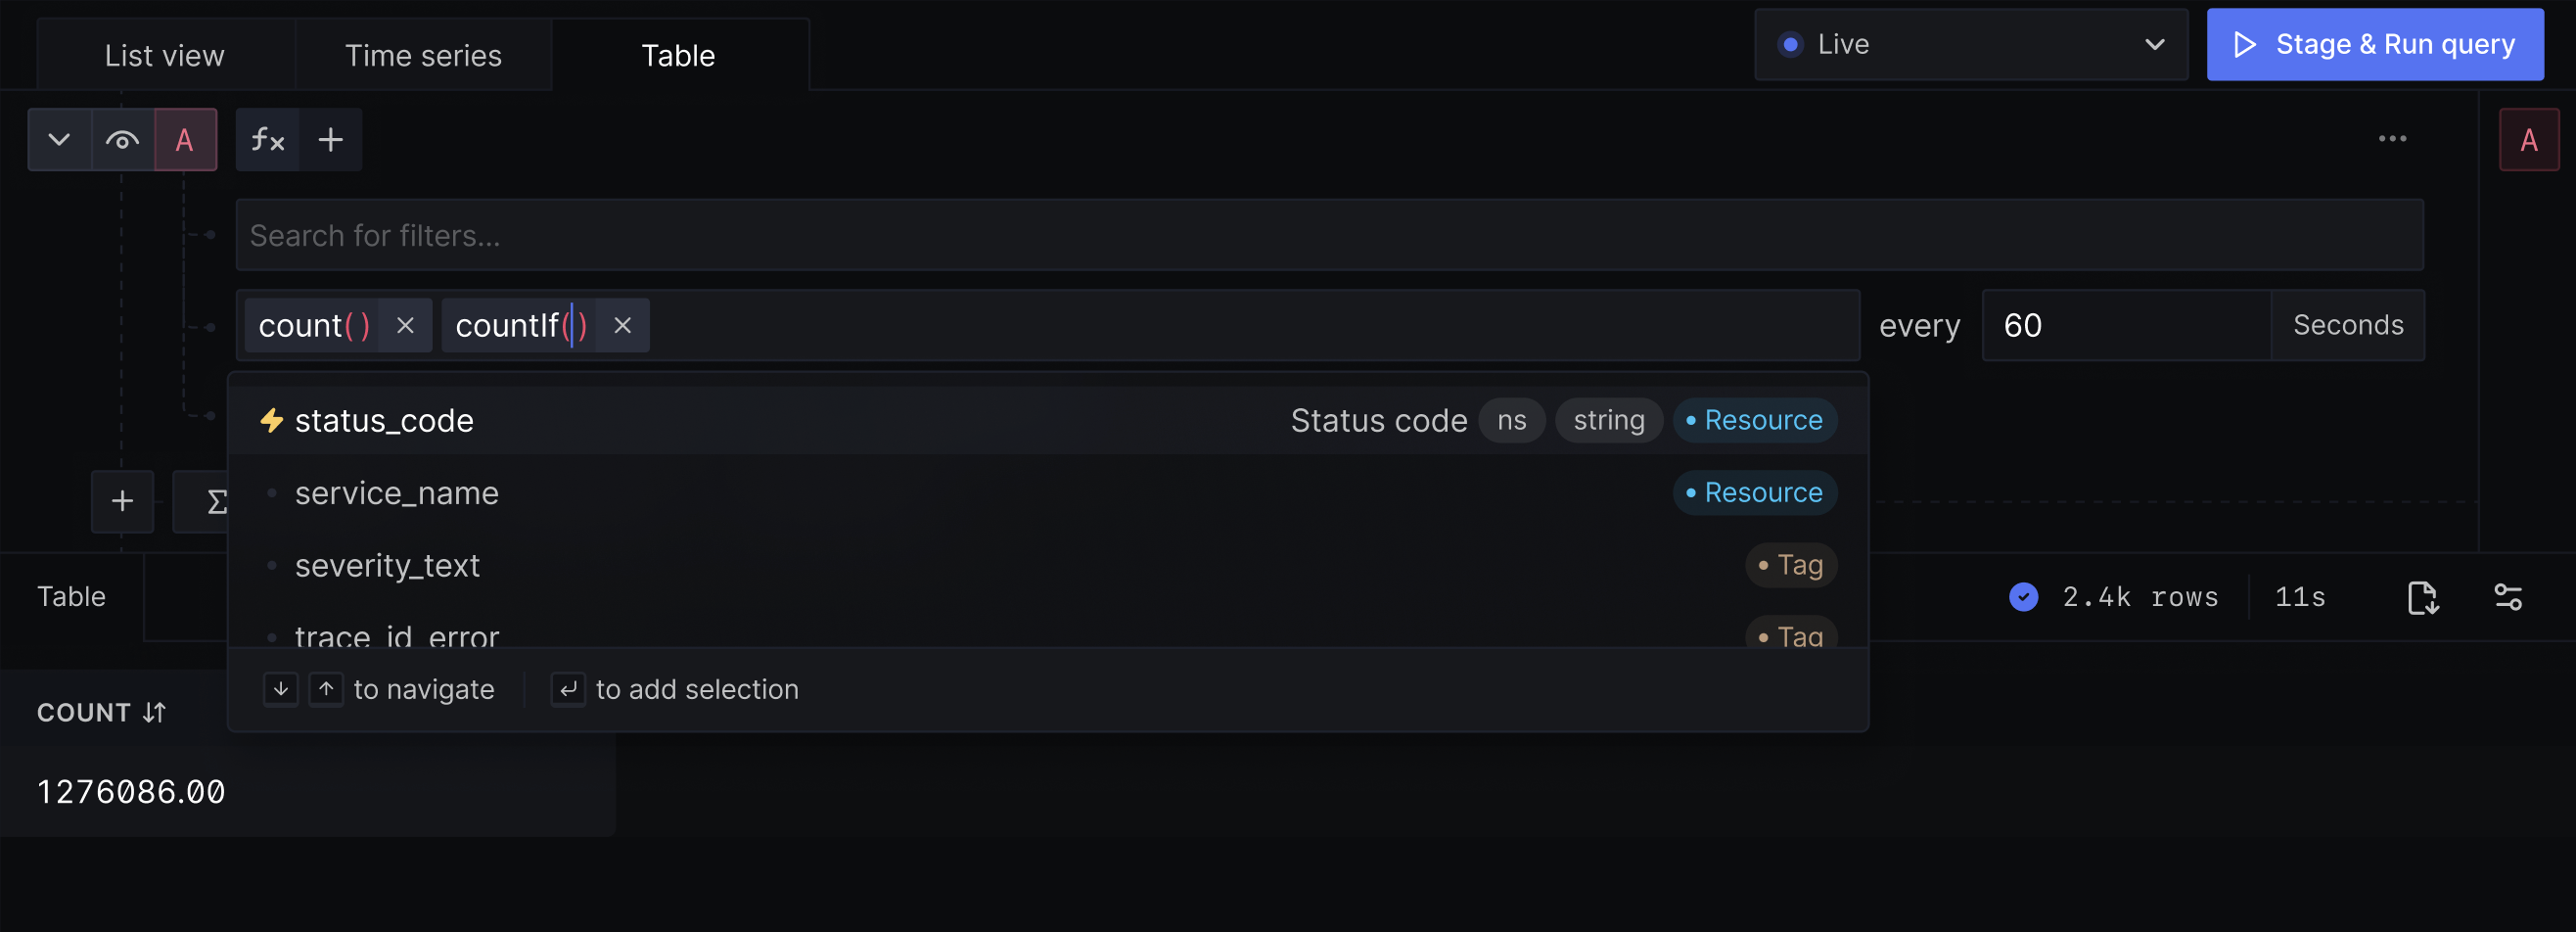
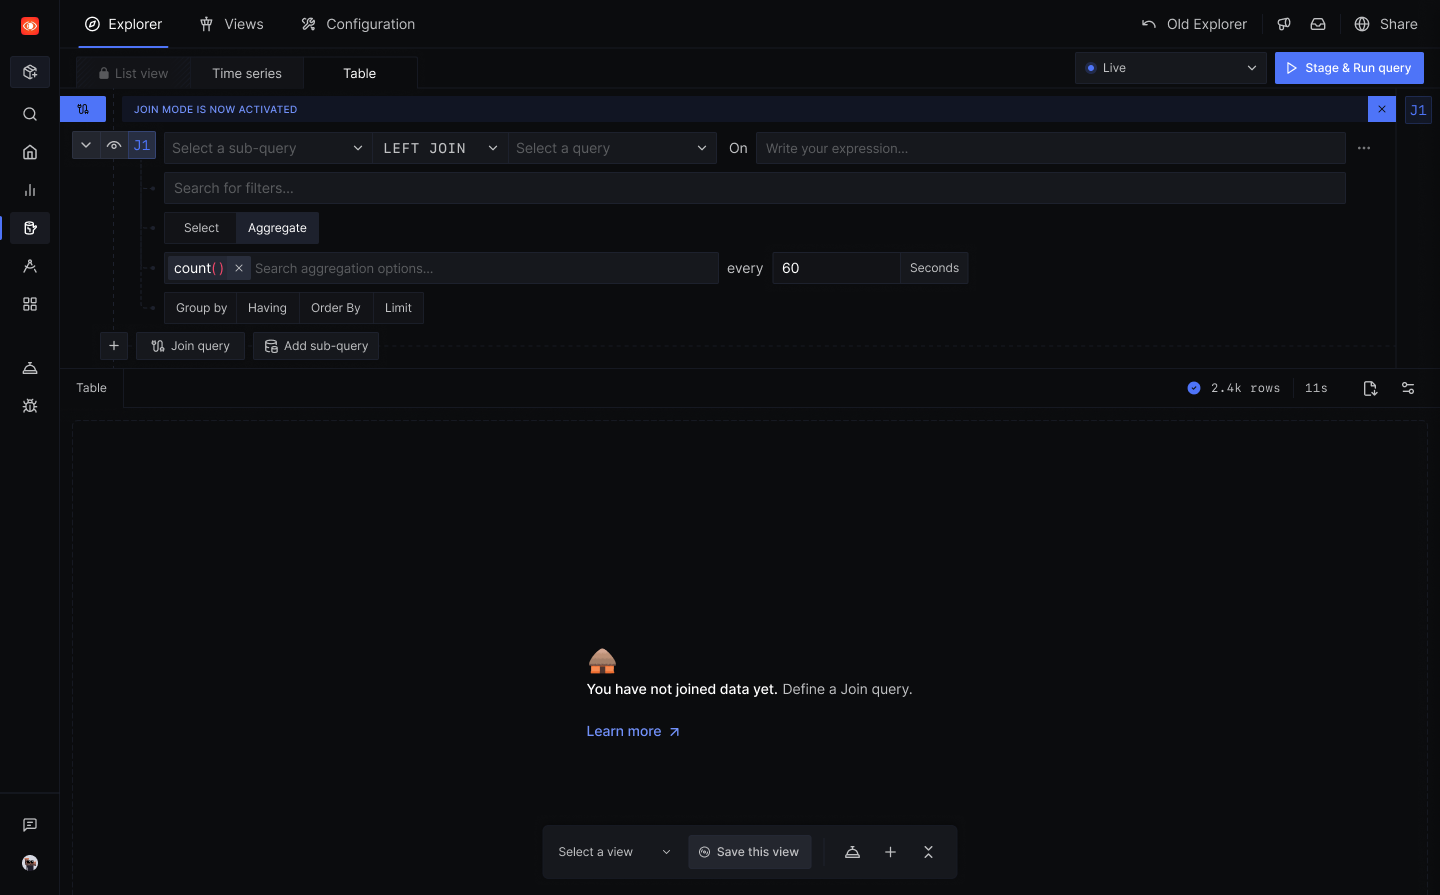
The New Query Builder
We have been actively working for over a year in upgrading what our query builder allows. We did not want to define a new DSL on top of Clickhouse (the database we use to store the signals) QL and wanted users to have the visual affordances necessary to craft queries that serve their purpose seamlessly, without having to learn yet another querying language.
We built the new query builder to also support functions, multiple aggregations as well as the ability to write custom expressions ⎯ which was important because not everything end-to-end can be GUI driven, while also ensuring we don’t give users to write dangerous Clickhouse queries that might crash their telemetry servers.
Wrap-Up
Besides all of these mentioned above, as the founding designer, I had also set up a component library along with design guidelines and the visual brand of SigNoz.
We also released multiple adjacent modules to explore your telemetry data easier ⎯ the ability to monitor Messaging Queues, External APIs, your entire Infrastructure and more greenfield projects like Trace Funnels that significantly enhanced the ability of developers to observe their systems and draw better correlations while investigating outages or failures.
We gave our Dashboards and Alerts a serious overhaul and are still continuing to talk to users and adding more pieces to make organization and observation even easier.
Reach out on my email to know more about these projects 🖖